Making Child-Language Data Clearer for Caregivers.

Redesigned a complex child-language report into a clearer, mobile-friendly experience that helps caregivers understand their results, interpret developmental data, and identify meaningful next steps.
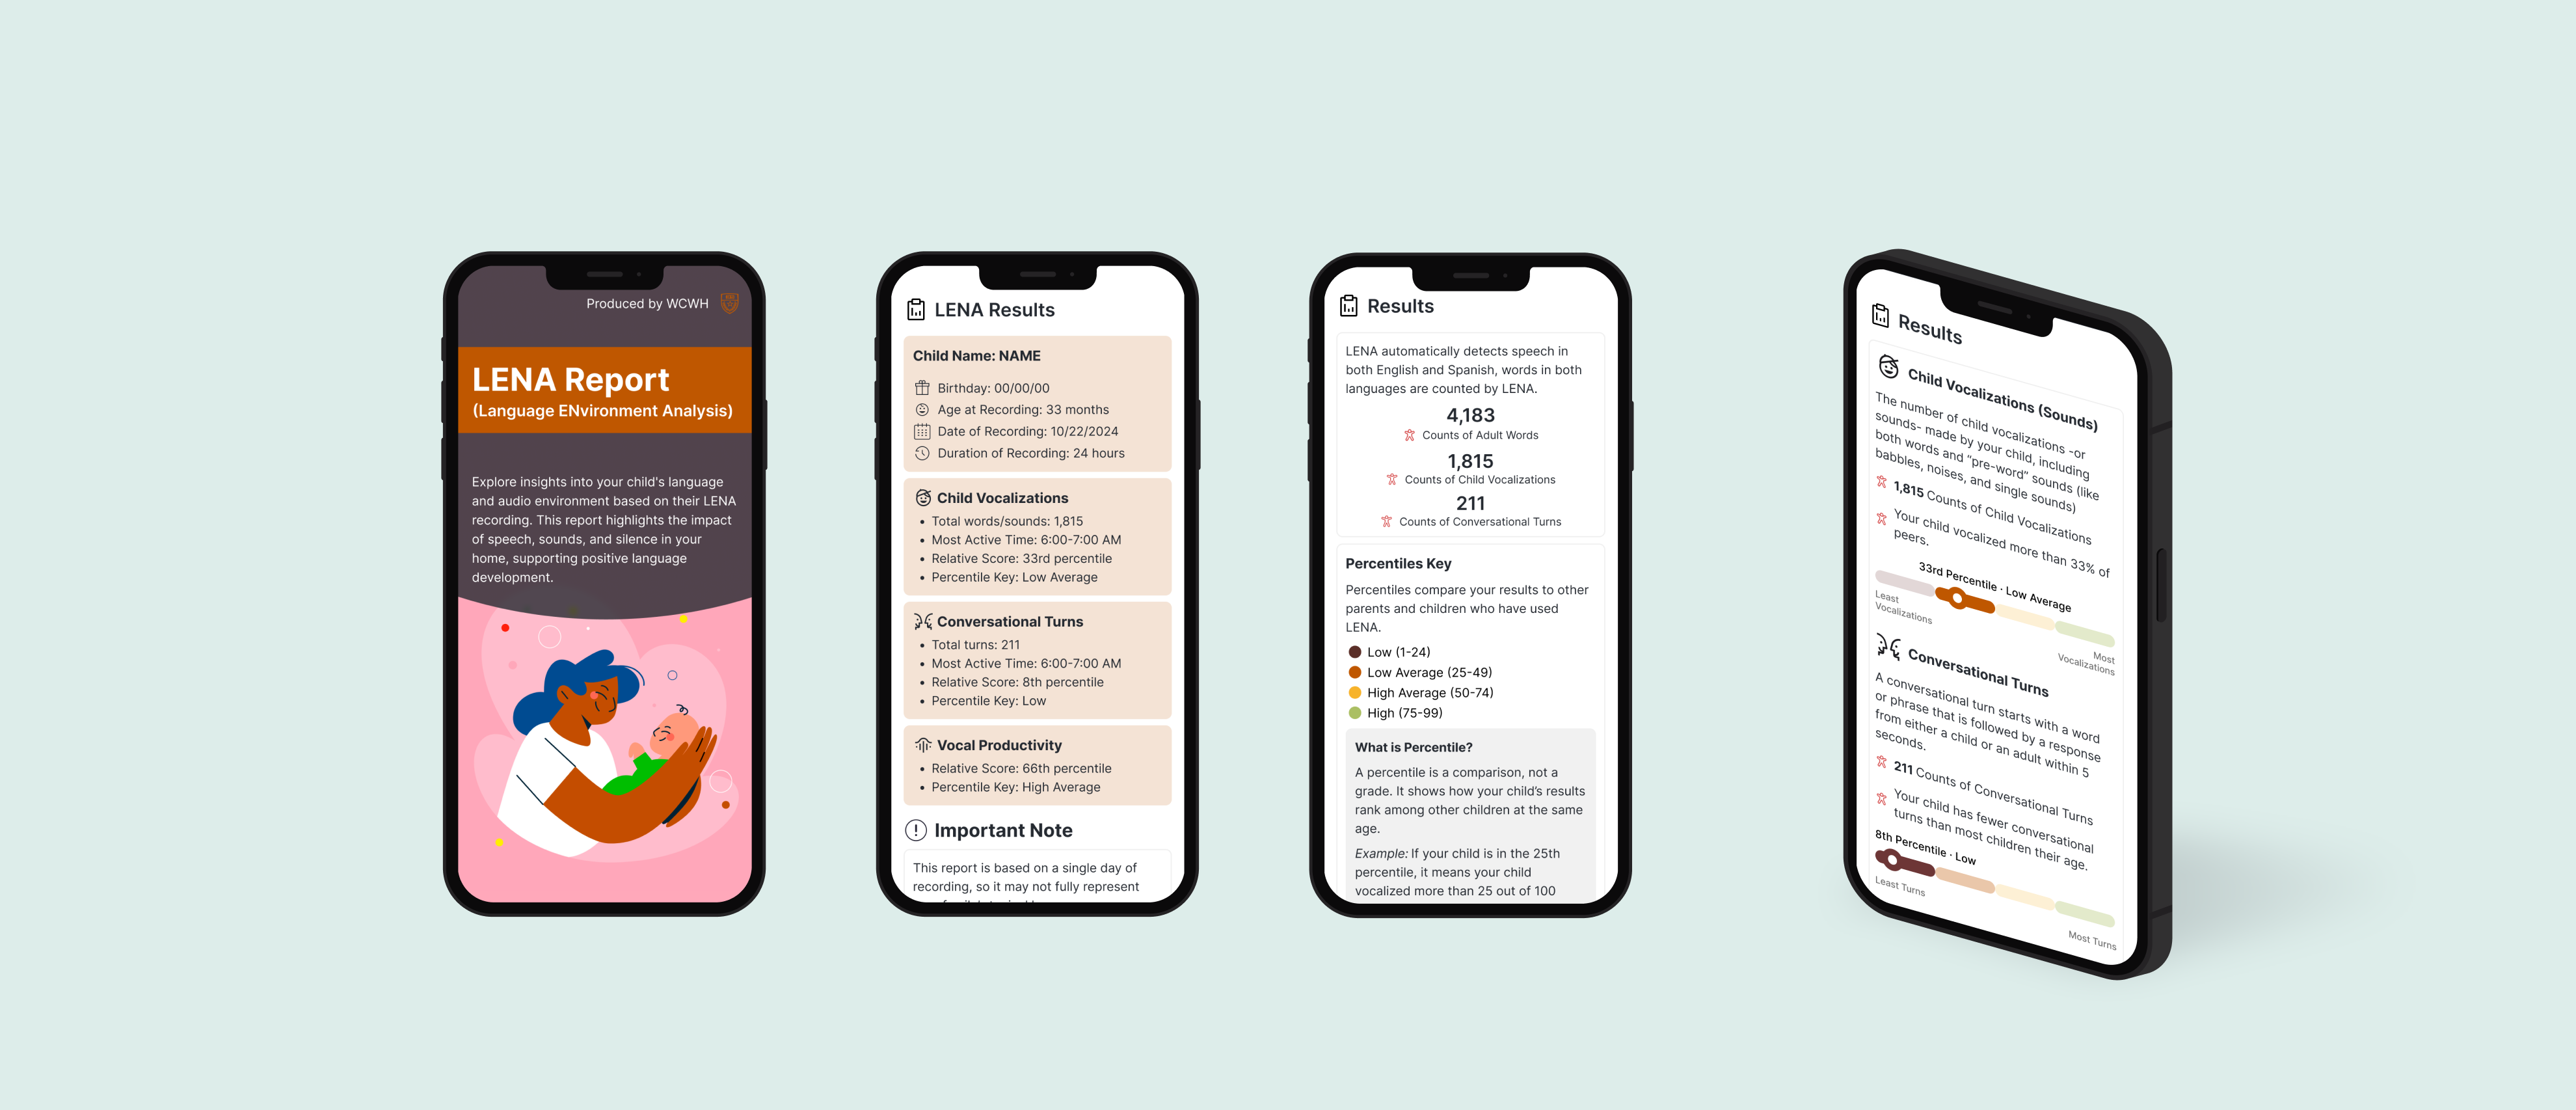
Four mobile LENA report mockups showing the introduction, results overview, percentile context, and detailed language measures
Role
UX Designer & Researcher
Timeline
Sep 2025 – Present
Team / Partner
Whole Communities–Whole HealthThe University of Texas at Austin
Scope
UX Research, Information Design, Data Visualization, Prototyping, Usability Testing

01 / Overview

Background

Whole Communities–Whole Health (WCWH) is a research initiative at The University of Texas at Austin studying how biological, environmental, and social factors influence the well-being of children and families. Within the study, caregivers receive individualized reports containing findings from different assessments.

LENA is a nonprofit organization that develops technology to measure children's language environments and interactions. Its system combines a small wearable recording device with software that analyzes measures such as child vocalizations and conversational turns.

Within the WCWH study, these findings are shared with participating caregivers through individualized reports to help them understand their child's language environment.

Challenge

The original LENA report contained valuable information, but technical terminology, dense explanations, complex visualizations, and a document-style layout made important findings difficult to interpret—especially on mobile.

Caregivers needed to understand what each metric represented, how to interpret percentiles, what their child's results meant, which information mattered most, and what they could do next.

How might we make child-language data more accessible, understandable, and actionable for caregivers?

02 / Research

Understanding where comprehension breaks down

Research Approach

01

Report Audit

Reviewed hierarchy, terminology, visualizations, and mobile readability.

02

Team Collaboration

Worked with the WCWH research team to understand report content, research context, and constraints.

03

Caregiver Testing

Evaluated how caregivers interpreted results, graphs, percentiles, and next steps.

04

Research Synthesis

Analyzed English-session findings and translated Spanish-language interview transcripts to identify recurring comprehension patterns.

Key Insights

01

Users needed meaning, not just data.

Caregivers wanted to understand what results meant for their child rather than simply seeing numbers, charts, or scores.

02

Visuals shaped first impressions.

Participants often looked at graphs and visual cues before reading explanations, making visual clarity critical to interpretation.

03

Percentiles needed context.

Participants could often read the number but were unsure what a percentile represented, how it differed from a percentage, or what the result meant for their child.

04

Clear guidance supported confidence and action.

Plain-language explanations, contextual reassurance, talking tips, and relevant resources helped caregivers feel more confident about understanding the report and knowing what to do next.

03 / Design

Design Highlights

Before

The original report contained valuable information, but its document-style layout made key findings difficult to scan and interpret, particularly on smaller screens.
  • Dense information hierarchy made important findings difficult to scan.
  • Mobile viewing often required zooming and horizontal navigation.
  • Technical terminology and limited contextual guidance made results harder to interpret.
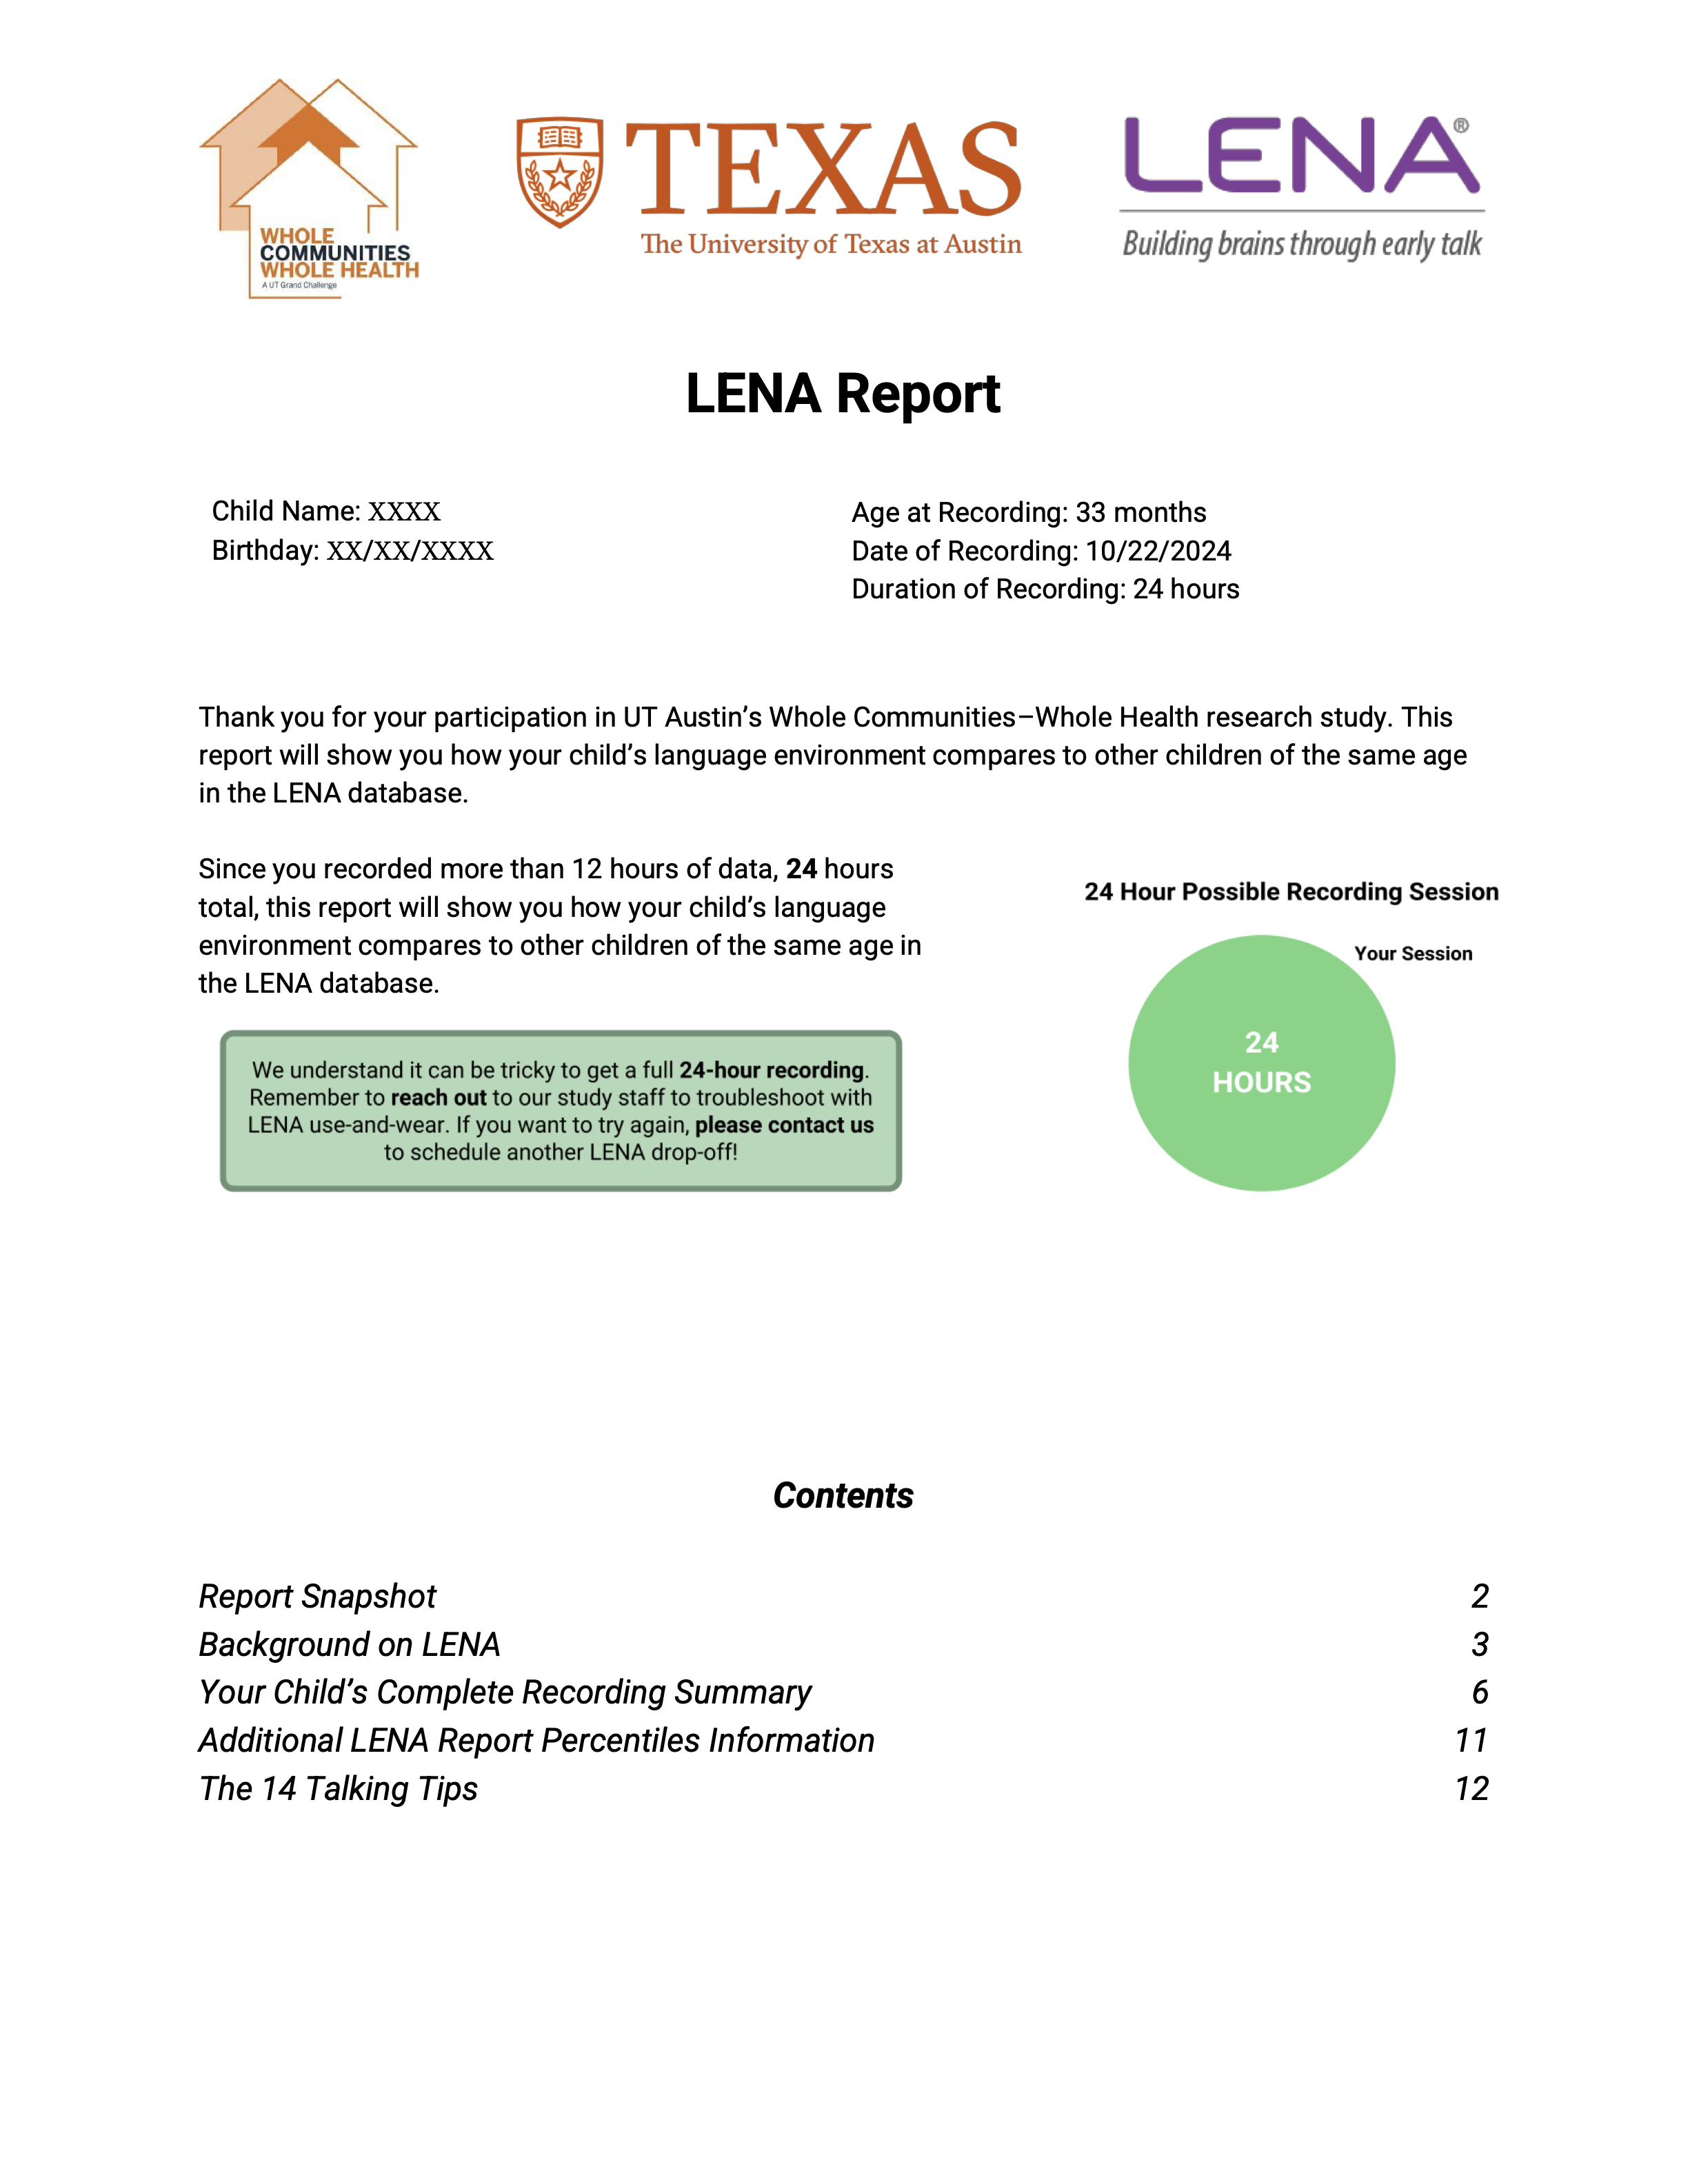
Original document-style LENA report introduction with recording information and contents

Original document-style LENA report introduction with recording information and contents

Original document-style LENA report introduction with recording information and contents
Original report: introduction and contents
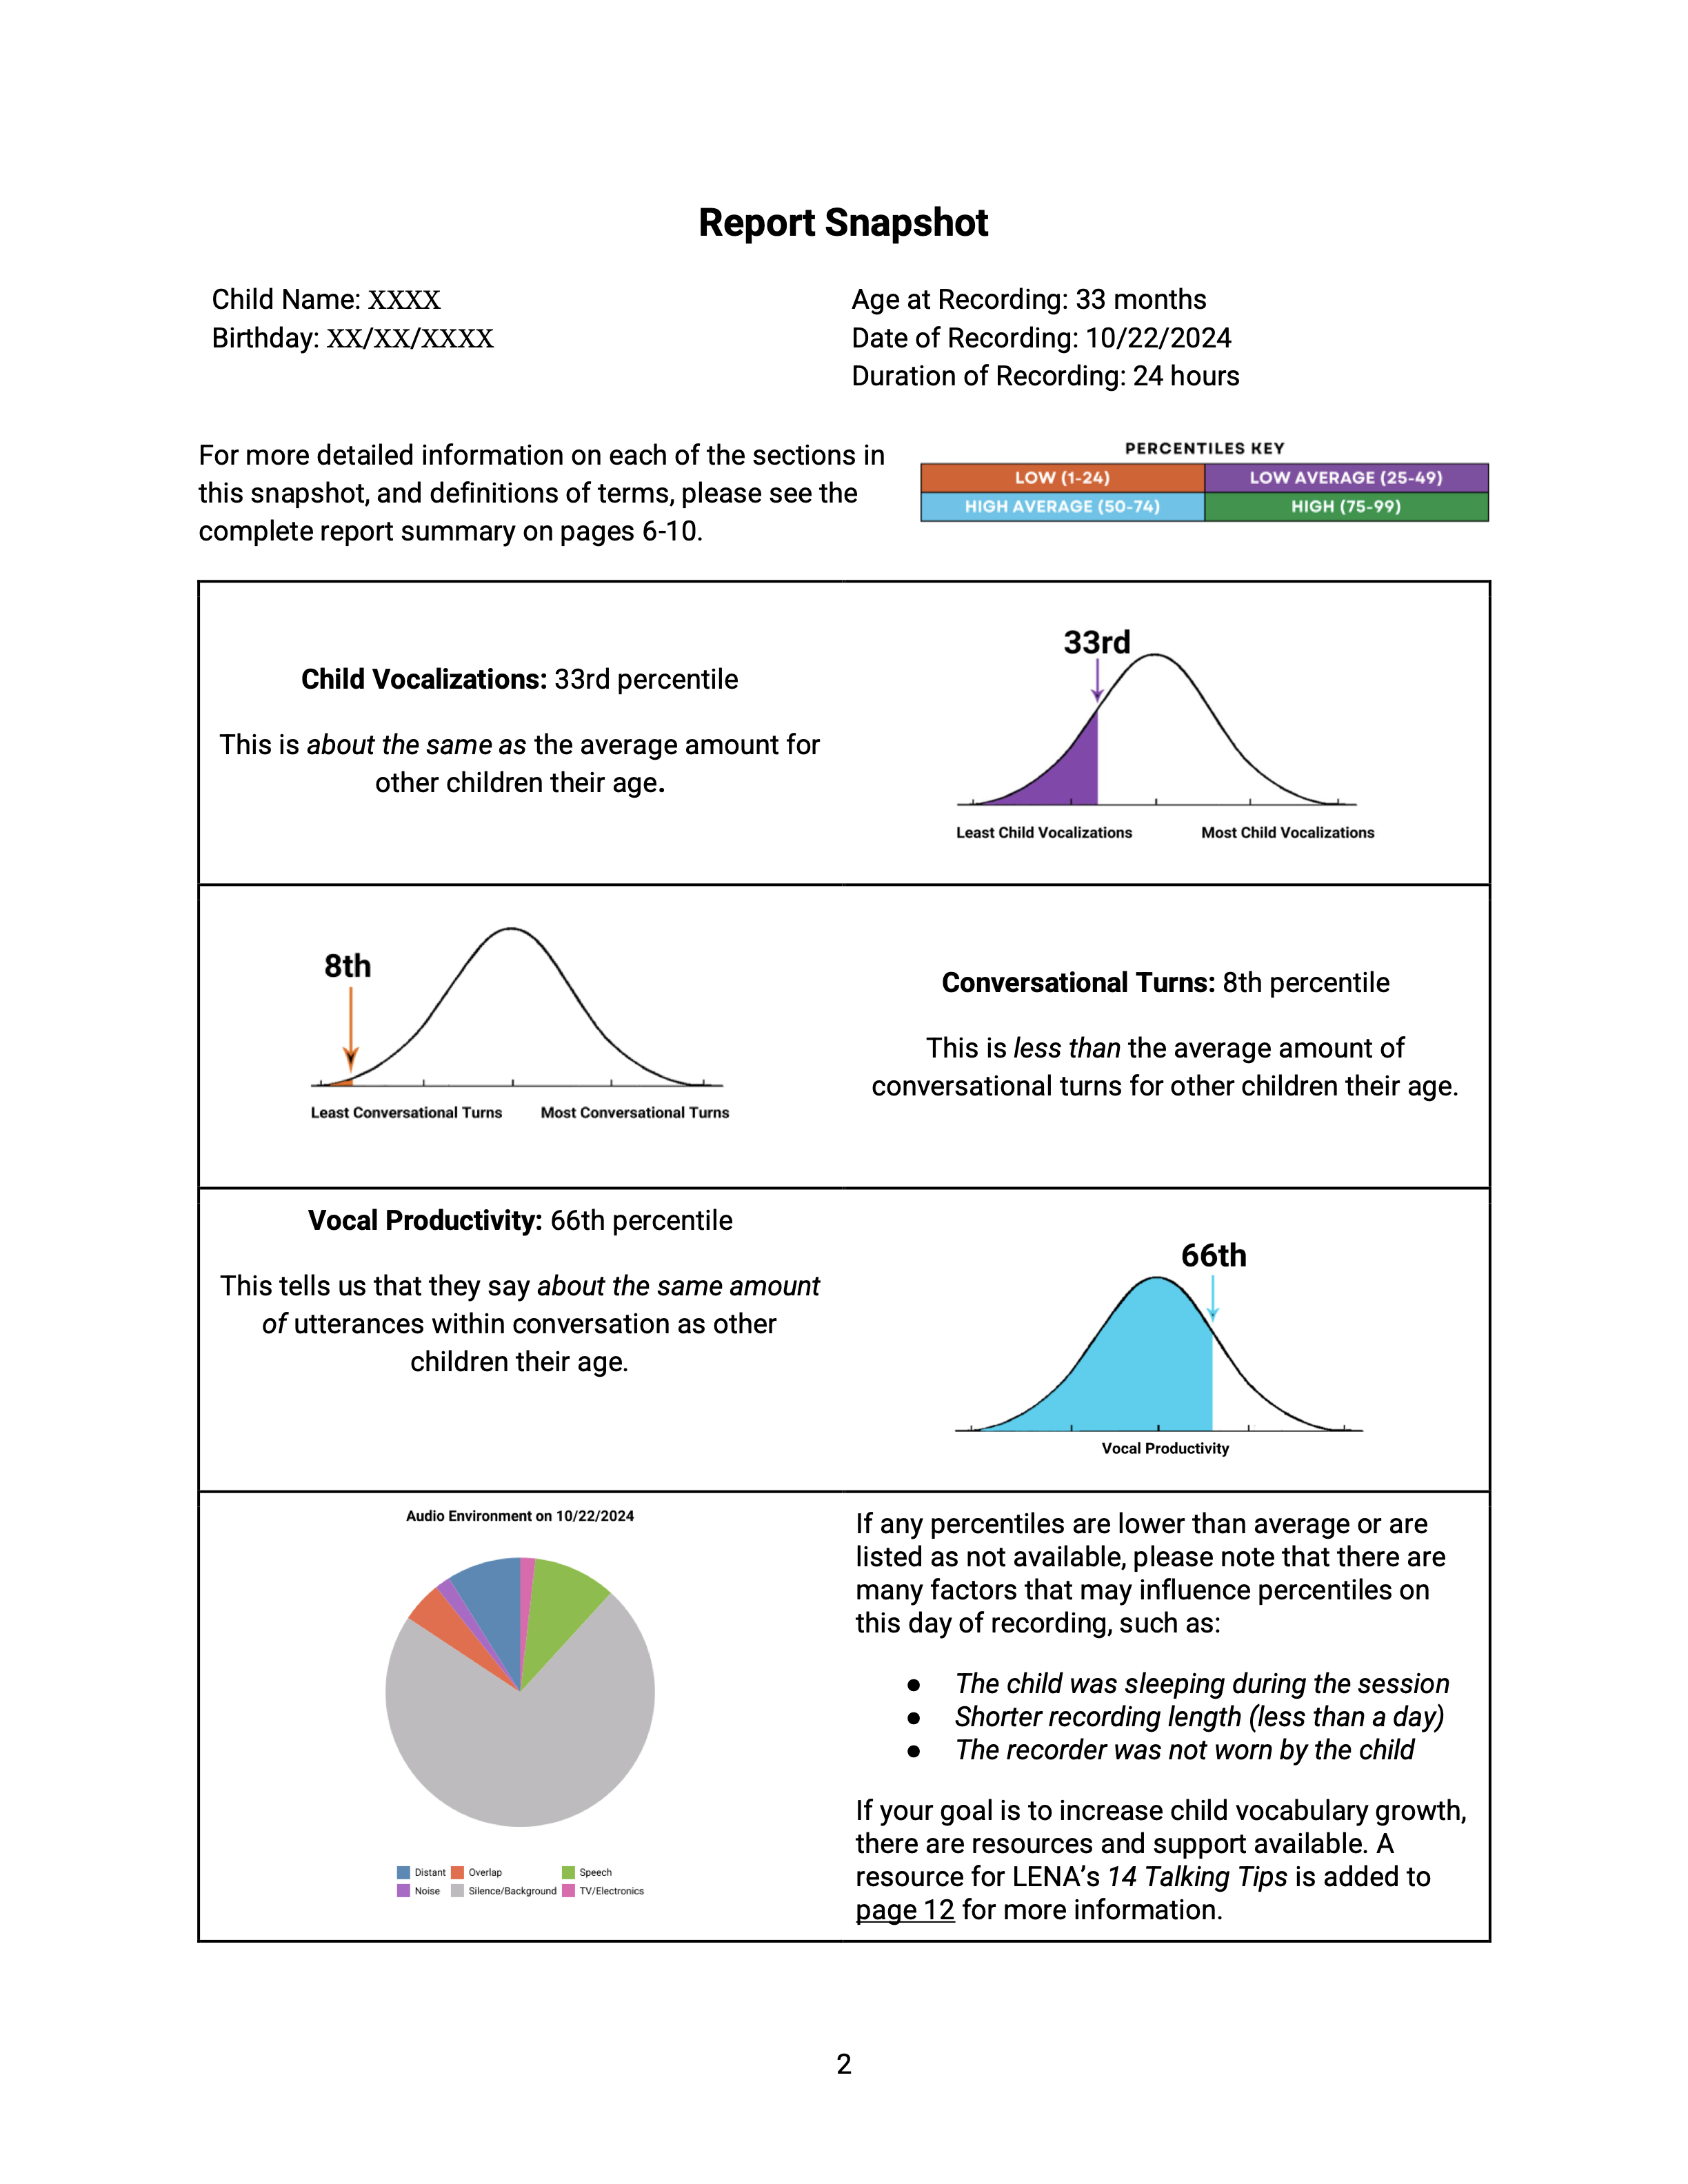
Original report snapshot with percentile curves and an audio-environment pie chart

Original report snapshot with percentile curves and an audio-environment pie chart

Original report snapshot with percentile curves and an audio-environment pie chart
Original report: results snapshot

01Mobile-First Readability & Navigation

  • Redesigned the report for smaller screens with a clearer reading flow and hierarchy.
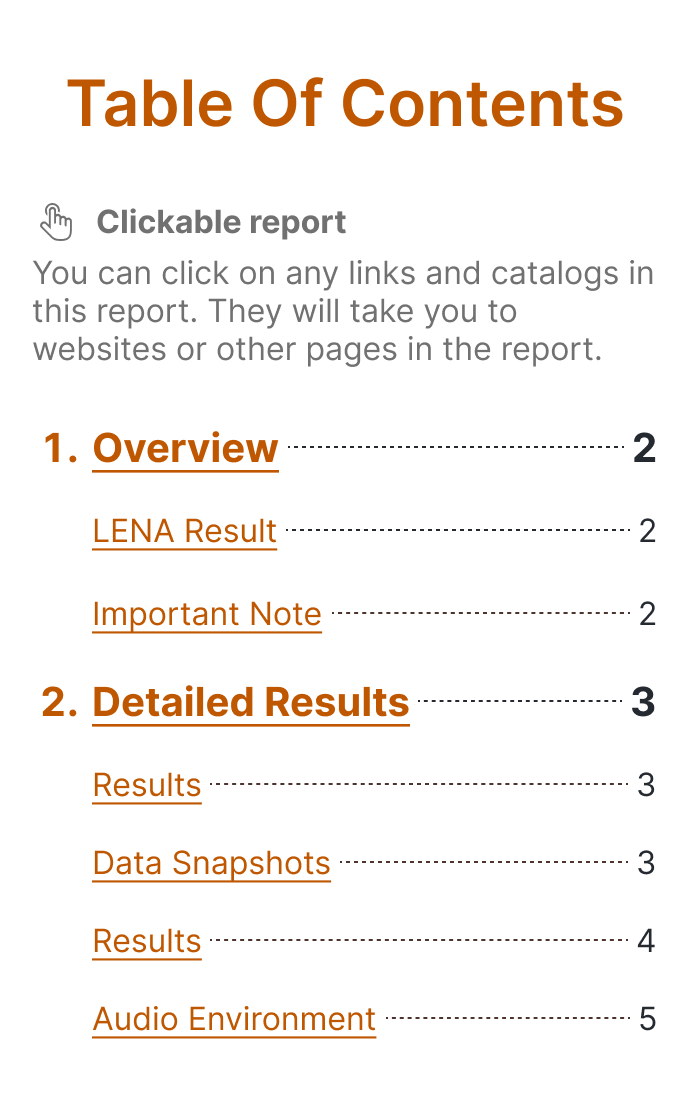
  • Added a clickable table of contents so caregivers could quickly reach relevant sections.
Redesigned table of contents linking to overview, LENA results, important notes, and detailed results

Redesigned table of contents linking to overview, LENA results, important notes, and detailed results

Redesigned table of contents linking to overview, LENA results, important notes, and detailed results
A clear entry point to relevant report sections
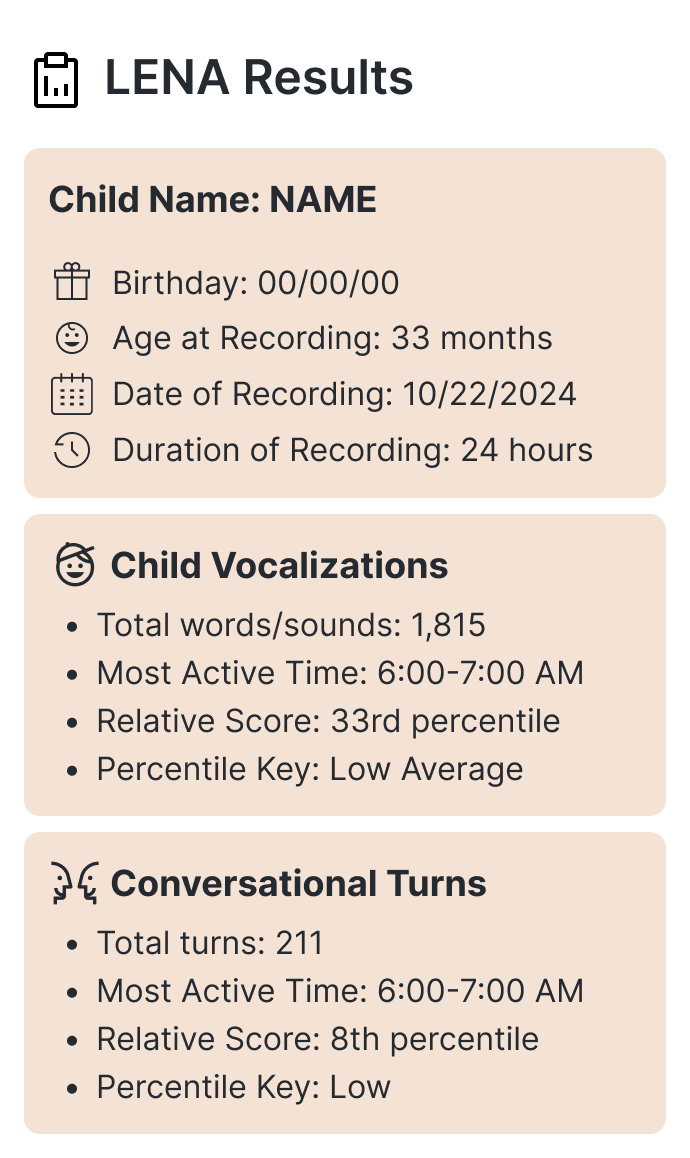
Mobile LENA results overview grouping recording details, child vocalizations, and conversational turns

Mobile LENA results overview grouping recording details, child vocalizations, and conversational turns

Mobile LENA results overview grouping recording details, child vocalizations, and conversational turns

02Clearer Data Interpretation

  • Surfaced key metrics before detailed results.
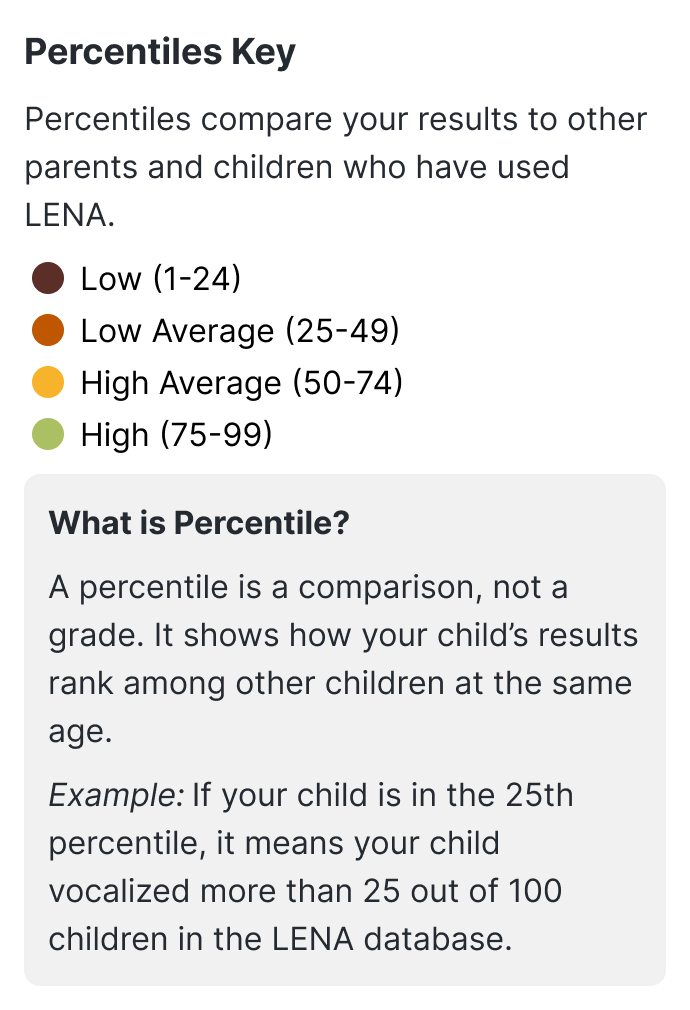
  • Added plain-language explanations and comparison context for unfamiliar concepts such as percentiles.
Percentile key explaining that a percentile is a comparison rather than a grade, with an example

Percentile key explaining that a percentile is a comparison rather than a grade, with an example

Percentile key explaining that a percentile is a comparison rather than a grade, with an example
Plain-language percentile context
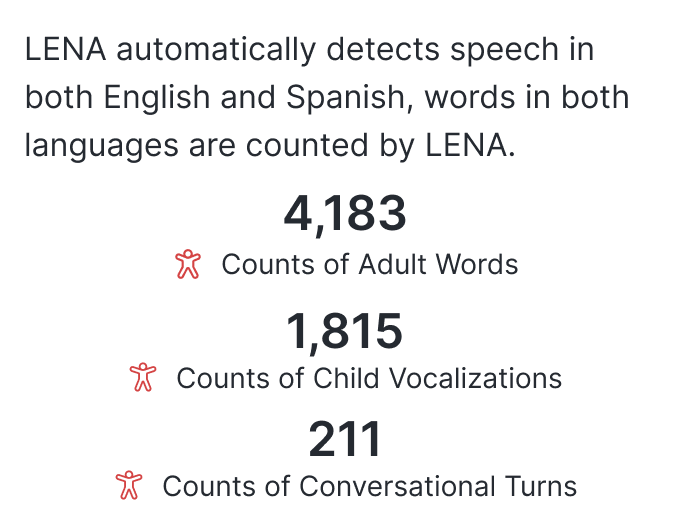
Overview of adult words, child vocalizations, and conversational turns

Overview of adult words, child vocalizations, and conversational turns

Overview of adult words, child vocalizations, and conversational turns
Key language measures before detailed results
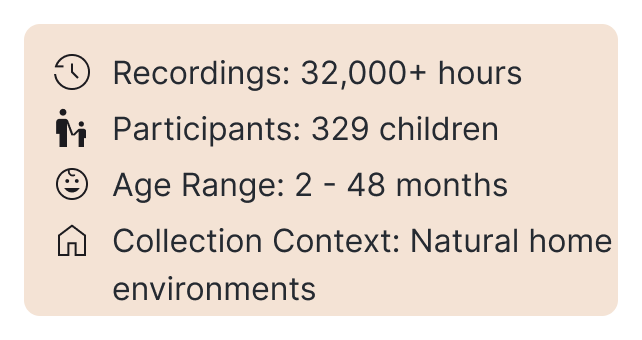
Context for the comparison dataset: recording hours, participants, age range, and natural home environments

Context for the comparison dataset: recording hours, participants, age range, and natural home environments

Context for the comparison dataset: recording hours, participants, age range, and natural home environments
Context about the comparison dataset

03Supportive Visual Communication

  • Simplified visualizations with clearer labels, icons, and visual cues.
  • Paired charts with concise explanations to connect each metric with its meaning.
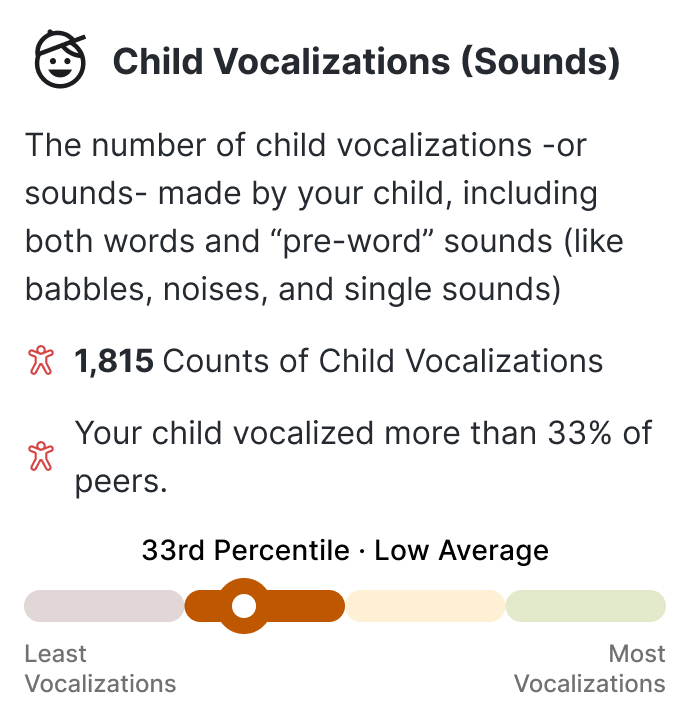
Child vocalizations explanation paired with a labeled percentile scale

Child vocalizations explanation paired with a labeled percentile scale

Child vocalizations explanation paired with a labeled percentile scale
Connecting a language measure with its meaning
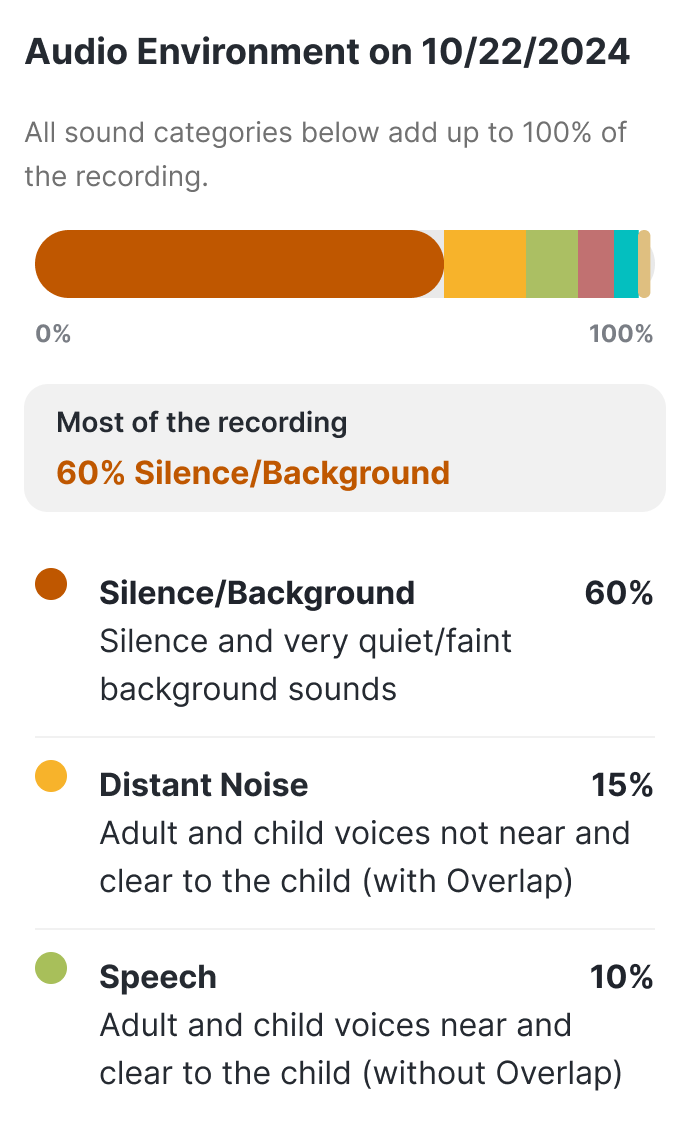
Audio environment breakdown with a stacked bar, labels, and descriptions of sound categories

Audio environment breakdown with a stacked bar, labels, and descriptions of sound categories

Audio environment breakdown with a stacked bar, labels, and descriptions of sound categories
Sound categories with descriptive context

04Actionable Next Steps

  • Presented language-development tips in a more approachable, scannable format.
  • Curated community resources with practical details such as audience, cost, format, and contact information.
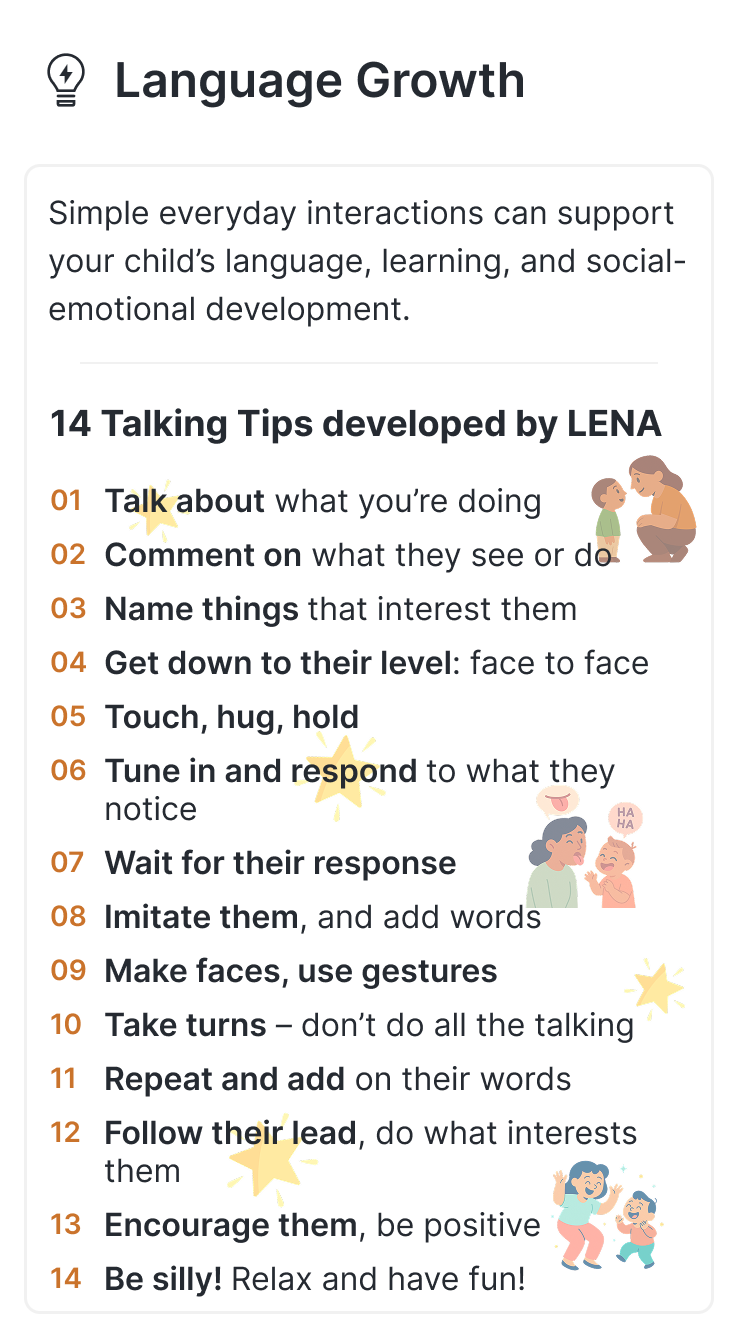
Fourteen everyday talking tips, including commenting, naming, listening, and taking turns

Fourteen everyday talking tips, including commenting, naming, listening, and taking turns

Fourteen everyday talking tips, including commenting, naming, listening, and taking turns
Approachable language-development activities
AVANCE resource card with audience, free Spanish-language parent-child classes, and contact details

AVANCE resource card with audience, free Spanish-language parent-child classes, and contact details

AVANCE resource card with audience, free Spanish-language parent-child classes, and contact details
Practical information for accessing community support

05Designing for Trust & Reassurance

Child-development data can feel personal or concerning, so the report also needed to support interpretation without minimizing the results.
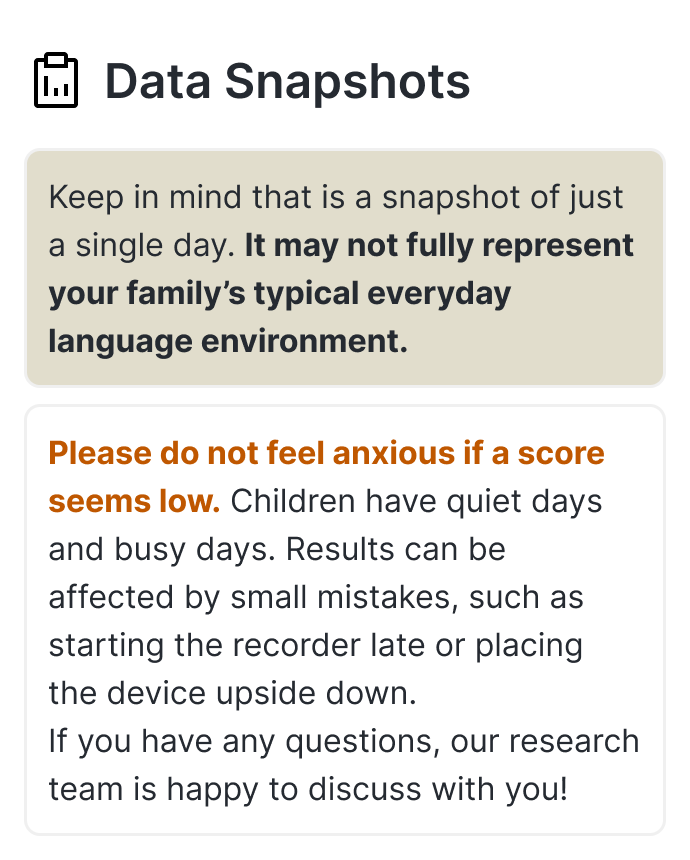
  • Added context explaining why a single recording may not reflect a child's typical day.
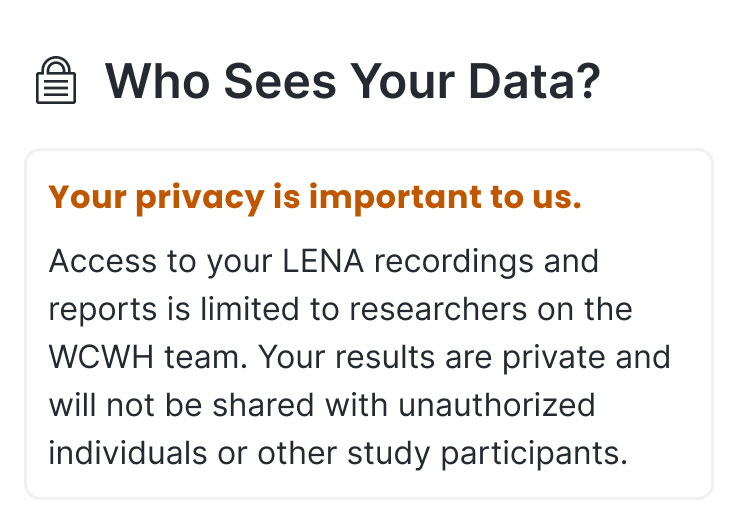
  • Clarified data privacy and provided a direct path to the research team for questions.
Data Snapshots explaining the limitations of a single recording and inviting questions to the research team

Data Snapshots explaining the limitations of a single recording and inviting questions to the research team

Data Snapshots explaining the limitations of a single recording and inviting questions to the research team
Context for interpreting a single recording
Privacy explanation limiting access to recordings and reports to WCWH researchers

Privacy explanation limiting access to recordings and reports to WCWH researchers

Privacy explanation limiting access to recordings and reports to WCWH researchers
Clear information about who can access the data

04 / Validation

Testing understanding, confidence, and next steps

One round of usability testing has been completed. I developed moderator scripts and scenario-based tasks to evaluate how caregivers navigated the redesigned report, interpreted graphs and percentiles, explained results in their own words, identified useful next steps, and described moments of confusion or confidence.

Early Outcomes

01

Visuals improved clarity

Participants generally found clearer graphs, labels, and visual cues easier to follow.

The graphs are very useful... it's easier to understand the data.
— Usability testing participant
02

Context was still needed

Some participants could read the data but were unsure how to interpret what percentile values meant.

26th percentile kind of scared me at first...
— Usability testing participant
03

Context supported confidence

Participants responded positively when the report explained how the data was collected and compared.

I think it does boost my confidence, where I know that you all are working with a good sample size.
— Usability testing participant
04

Actionable guidance helped

Participants valued talking tips, resources, and practical recommendations that connected the report to next steps.

That enables me to take action, or do something extra, to help them improve.
— Usability testing participant

05 / Reflection

Reflection

Accessible information design is not simply about reducing text. It requires balancing research accuracy with the needs, confidence, and lived experiences of the people receiving the information.

The project also reinforced that comprehension and confidence are closely connected. A user may technically understand a graph while still feeling uncertain about what it means. This shifted the design focus from task completion alone toward clarity, context, trust, and meaningful action.

Next Steps

The second round of usability testing is planned within approximately the next 1–1.5 months.

  1. 01

    Conduct the next round of usability testing to evaluate the latest report iteration.

  2. 02

    Continue analyzing qualitative feedback, including translated Spanish-language transcripts, to identify recurring comprehension patterns.

  3. 03

    Refine language, visualizations, and recommendations based on the next round of findings.

  4. 04

    Prepare the final report design and implementation guidance for the WCWH team.